Reports
View detailed reports in your personalized TraceMail dashboard. Visit the reports page, select a time period, and view your data. You are required to have a premium subscription to access the advanced report page.
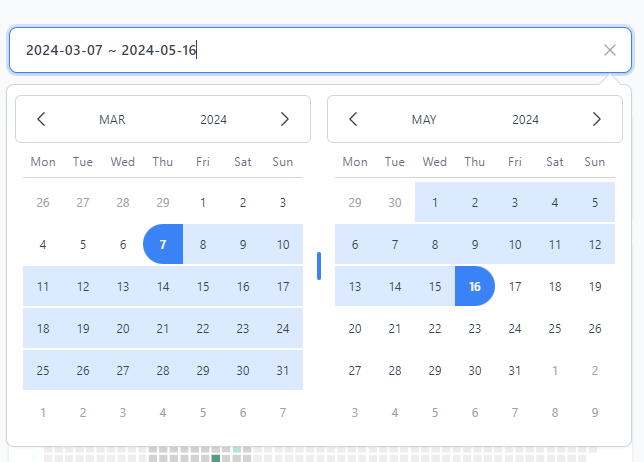
The selected time period will determine the data displayed in the reports. Select the period like the image below:
Outgoing
Total number of emails you've sent within the specified time range and the count of unique recipients they've been sent to. This reflects your overall outgoing email productivity, regardless of whether these emails were tracked or not.
Incoming
Total number of emails you've received within the specified time range and the count of unique senders that sent them to you. This reflects your overall incoming email traffic.
Trackings
Total trackings sent within the specified time range, with each recipient in each campaign counting as one tracking. For example, 1 tracked email sent to 3 recipients will count as 3 individual trackings.
Activities shows the number of tracking activities triggered within the specified time period. Each time a recipient opens one of your tracked emails, clicks on one of your tracked links or interacts with one of your tracked documents, it counts as a tracking activity. Note that multiple openings of the same email, link or document will trigger additional tracking activities.
Campaigns
Total number of tracked emails you've sent within the specified time range and how many have been opened by at least one recipient. Contrary to trackings, 1 email with 3 recipients will count as 1 campaign.
Links
Total number of tracked links you've sent within the specified time range and how many have been clicked at least once.
Documents
Total number of tracked documents you've sent within the specified time range and how many have been opened at least once.
Trackings sent by day
An overview and heatmap showing the selected timeframe of the number of tracking emails sent each day within the specified time period. Hover over a day to see the exact number. You can also click on a day to see the detailed tracking activities for that day.
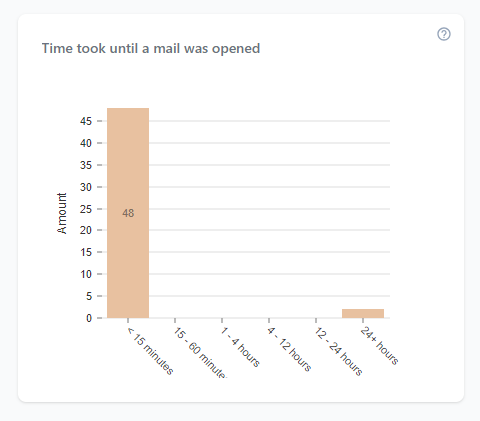
Average time to email open
The time it takes for your recipients to open your tracked emails. The time is calculated from the time you sent the email to the time the recipient opened it. The buckets show in:
- < 15 minutes
- 15 minutes - 60 minutes
- 1 hour - 4 hours
- 4 hours - 12 hours
- 24+ hours
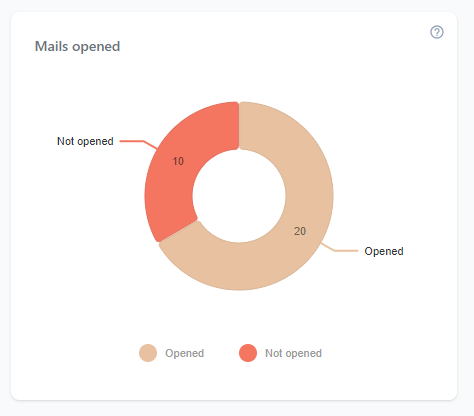
Mails opened
The chart shows the number of emails opened and not opened within the specified time period.
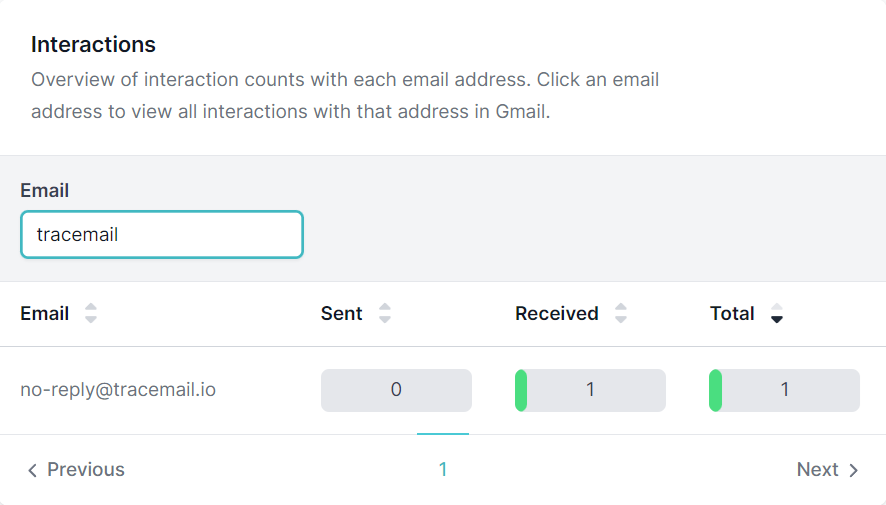
Interactions
A list of email addresses that you've interacted with in the specified time range, including how many mails you've sent to and received by them and the total amount of interactions with each address. The list can be filtered by email address and sorted by email alphabetically, or by sent, received and total count.
Need more reports?
We offer custom reports for our premium and enterprise customers. If you have specific requirements, please contact info@tracemail.io to discuss your needs. We are happy to help you with your tracking needs.